Uganda Ministry of Health


Makerere University


Pulse Lab Kampala, in partnership with the Ministry of Health of Uganda and World Health Organisation, is working on a tool to support the response to disease outbreaks. The Uganda Ministry of Health uses a Health Management Information System (HMIS) to track diseases throughout the country. The data that feeds the system is routinely collected by health facilities on a weekly basis. The Pulse Lab Kampala tool uses Big Data Analytics to correct missing data, produce data visualisations and incorporate risk factor information. Supporting faster and better response to disease outbreaks.
Scroll down to have a preview of the tool. Please note: this version is under active development and contains glitches.
Health surveillance data can be visualised over time allowing better understanding of the spread of the disease. The time slider below shows weekly data over the calendar year. Data is represented per district and sub-county, allowing tracking of the disease at local level. To further inform the response to outbreaks, counts and percentiles of cases and correction for missing reports are available.
Note: the interface below shows simulated data, and not actual disease counts, for the purpose of demonstrating the operation of the tool only.

Loading chart...
Loading map...
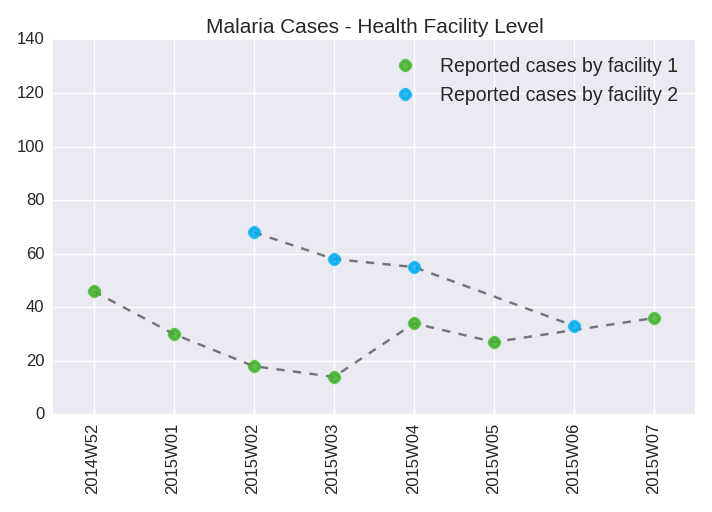
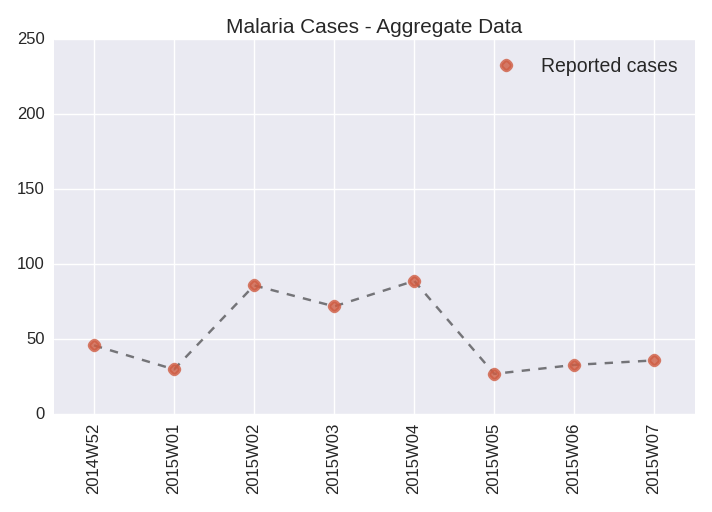
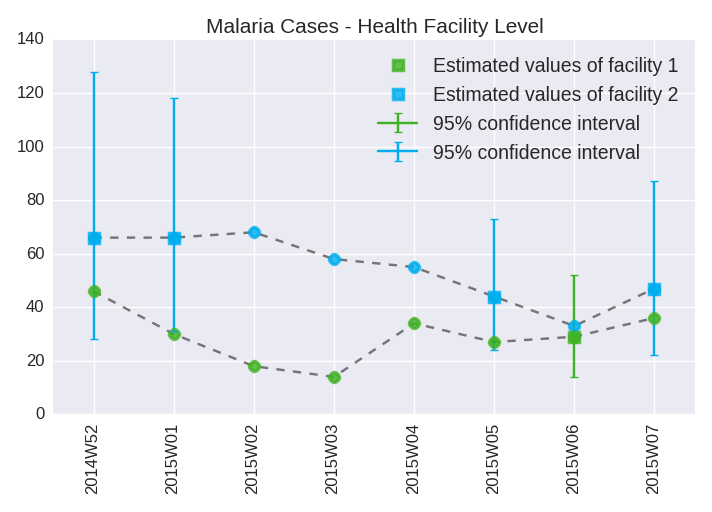
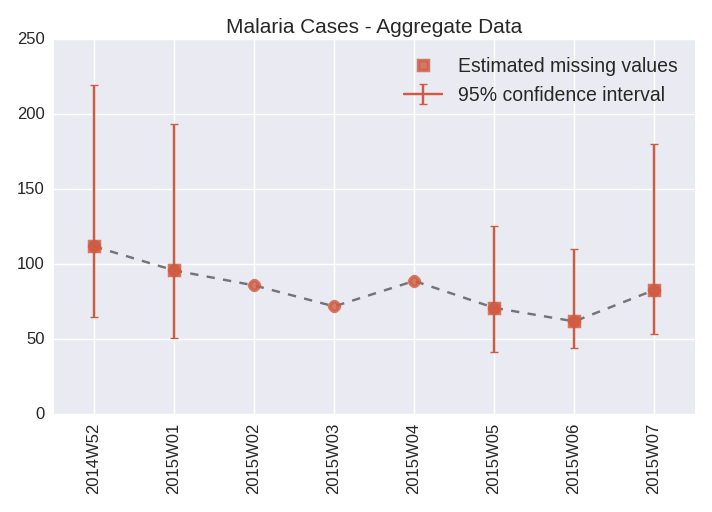
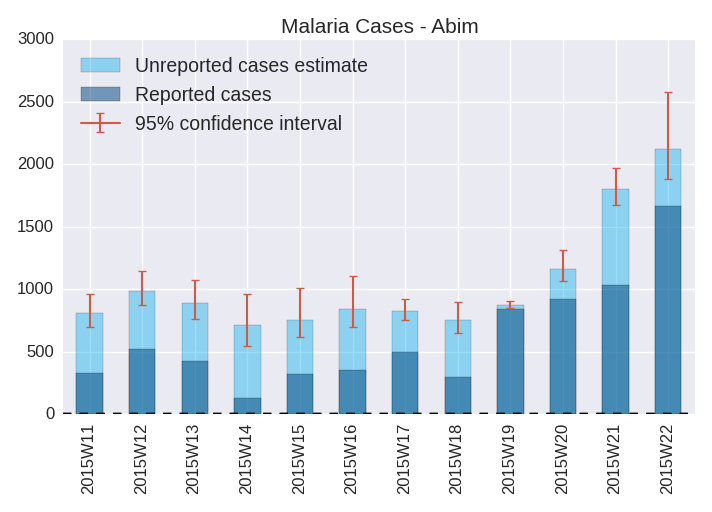
Not all health facilities report every week on disease cases. The unreported cases cause misleading trends if they are not computed. The tool corrects the data showing more accurate counting of the number of affected people.
Here’s why the Pulse Lab Kampala tool corrects for this and why that is necessary. Hovering over the images will pause the slideshow, allowing you time to fully absorb the explanation.
Assessing risks factors is key to managing the response to disease outbreaks. The tool incorporates data from satellite imagery, surveys and telecoms to use correlations to build scenarios.
The overlay with section 1 will allow calculation of risk scores and predicting modelling.
UCSB Climate Hazards Group InfraRed Precipitation with Station data (CHIRPS). This dataset
combines satellite imagery with ground station measurements to give detailed rainfall information.
More
information

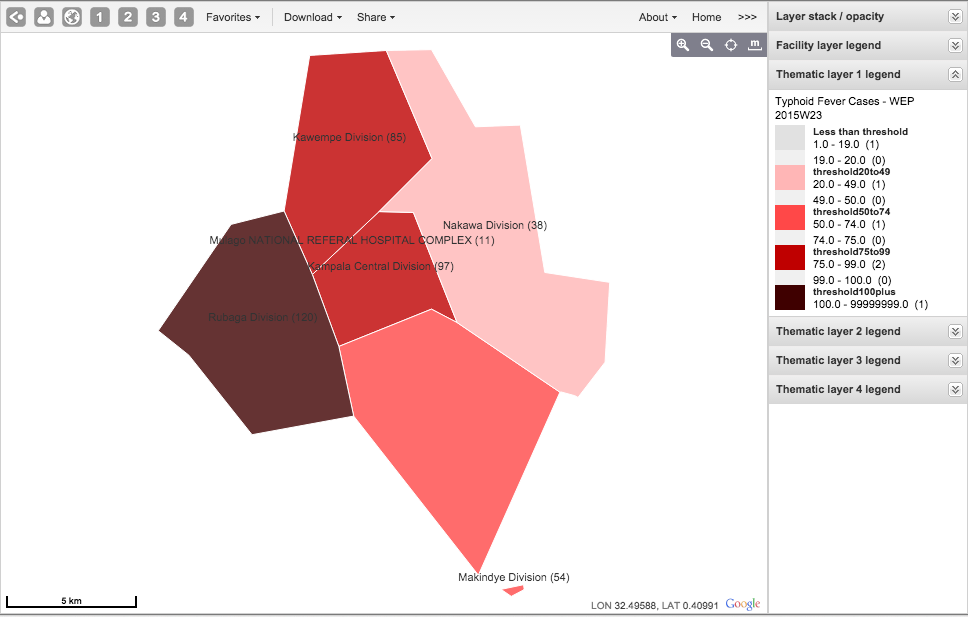
On the request of the Ministry of Health, Pulse Lab Kampala became a member of the Typhoid National Task Force supporting the response to the disease outbreak early in 2015. The Lab prepared a series of interactive data visualizations to help enhance the response. As shown below, the new visualisations showed precise outbreak locations and contextual data in a way that had not been possible with the existing tools.
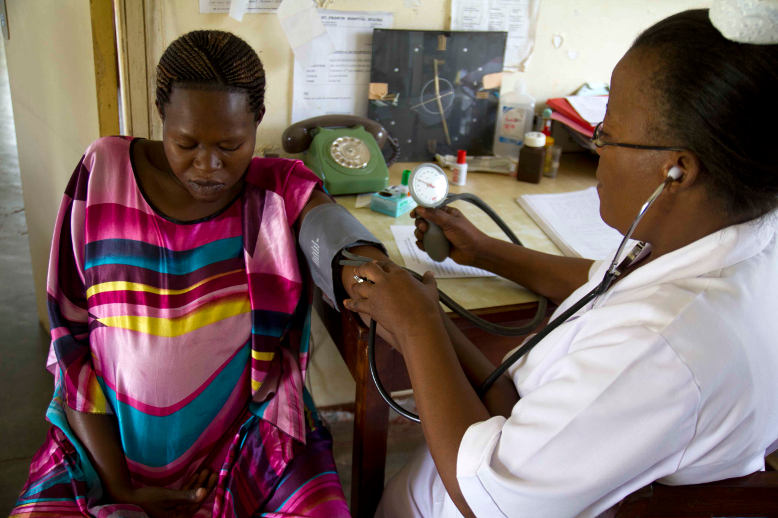
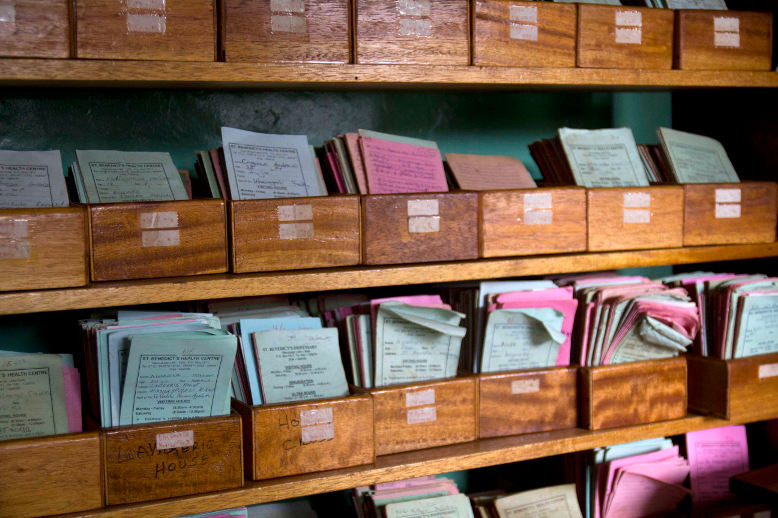
Health facilities at local levels enter data about for example new cases of malaria, typhoid and dysentery into the Ministry of Health's Management Information System (HMIS) on a weekly basis.
The tool can access this data and correct issues such as district names with are sometimes spelled differently; e.g. Kisaasi, Kiisasi both are corrected to Kisaasi as the primary name. Unreported, missing cases are also corrected for, providing a more accurate counting of the number of people affected by a disease.
Open data sources are used to pinpoint the exact location of data-entry points; the sub county health centres. With this information it is possible to visualise current cases, per disease, per area. Extra layers of information are added such as population data and weather data.
An online dashboard, which will be integrated into the HMIS, provides the Ministry of Health quick insight in the current status of disease within the country. This allows for a faster and more efficient response to disease outbreaks.
This prototype will be fined tuned with feedback from partners and users. The tool will be incorporated into the Ministry of Health DHIS2 system, e.g. as an application to complement the existing interactive tools such as the pivot table. DHIS 2 is a health management information system used in 47 countries and 23 organisations across four continents. As this system is an open source platform, once incorporated in Uganda, the tool will be available for countries around the world.
The privacy issues are addressed through the privacy and data protection principles set out by UN Global Pulse. These principles are designed to ensure that the data analysed is handled with the utmost protection of the interests of the individuals involved.
A project involving analysis of medical data naturally requires high levels of privacy considerations and protection and Pulse Lab Kampala takes extra measures to protect the people behind the data and applies strict privacy principles to ensure that individuals are not exposed in a way that is to their disadvantage.
Pulse Lab Kampala is the third lab of the United Nations Global Pulse network under the leadership of the UN Resident Coordinator. It supports the UN Country Team and the Government of Uganda to achieve the Global Goals for sustainable development. As a regional hub, it leverages data innovation, new sources of digital 'Big Data' and real-time analysis techniques.
Sign up for our monthly data update here

Photo credits: Naomi De Groot